Prism Versus Diffraction Grating?
Either a prism or a diffraction grating is
used as the wavelength dispersive
element in most optical spectrometers
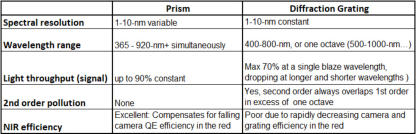
Prism Versus Diffraction Grating Performance
Detailed Diffraction Grating Characteristics
Grating “Pros” • Off the shelf optional groove densities and wavelength dispersion options • Wide selection of blaze wavelengths Grating “Cons” • Produced either mechanically with burnished grooves (incorporates “ruling errors”) or holographically with limited groove density potential • All have a peak efficiency at just one wavelength (the “blaze” wavelength). Diffraction efficiency drops off rapidly to shorter and gradually to longer wavelengths. See Figure 1 • Grating efficiency curves present “anomalies” or discontinuities in the efficiency profile. • Classical “mechanically ruled” gratings are more efficient that those produced holographically • The efficiency curves of all diffraction gratings are affected by light diffraction into higher “orders” • Each order is one octave, for example, 400 to 800-nm. Second order will be 200 to 400-nm and overlay first order. See Figure 2 • To remove second order overlap order sorting filters are required • In actual practice peak efficiency of a diffraction grating is almost always less than 70% and can drop to near zero at the extremities of its spectral range • Wavelength dispersion (nm/mm) is non-linear varying as the diffraction angle and the distance to focus at each wavelength. In practice, wavelength dispersion is linear enough to present near constant resolution especially for low resolution instruments Bottom line: Ruled gratings are more efficient than many holographic gratings when considered over a wide wavelength range. Nevertheless diffraction gratings cannot be used over a wavelength range greater than an octave without order sorting filters.Detailed Prism Spectrometer Characteristics Pros and Cons
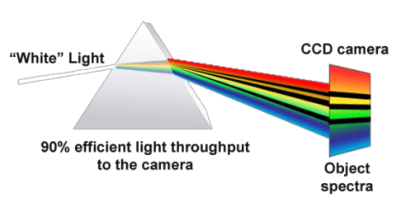
The major attraction of a prism is the near <90% average transmission efficiency at all wavelengths above ~365-nm. The efficiency profile is flat with no drop-off after ~400-nm. In terms of efficiency a prism will outperform all diffraction gratings. Prism “Pros” Ironically non-linear wavelength dispersion! As the QE of a camera decrease at longer wavelengths bandpass falls to compensate. Consequently, a prism delivers significantly higher signal to noise ratio over an extended wavelength range than a diffraction grating. See Figure 3. Transmission efficiency is a flat > 90% over the bulk of a wavelength range above ~400-nm outperforming all diffraction gratings Refraction does not result in “overlapping orders,” consequently a prism operates over greater than one octave without requiring filtering. Prisms work from 365 to 920-nm or above. Figure 4. Diffraction gratings split up incoming light into diffraction orders reducing efficiency. To see the PARISS imaging prism spectrograph click here Prism “Cons” • Compared to gratings, prisms are very expensive. Only high end instruments addressing challenging applications use a prism. • Wavelength dispersion is non-linear, consequently bandpass and resolution change from high in the blue to lower in the red. Linearizing dispersion is trivial in the software, but does not compensate for impact of changing bandpass. • Prism spectrometers share non-linear dispersion with both AOTF and LCTF devices (Acousto optic tunable filters and Liquid Crystal Tunable filters)Best Uses For Prism and Diffraction Grating Spectrometers FAQ
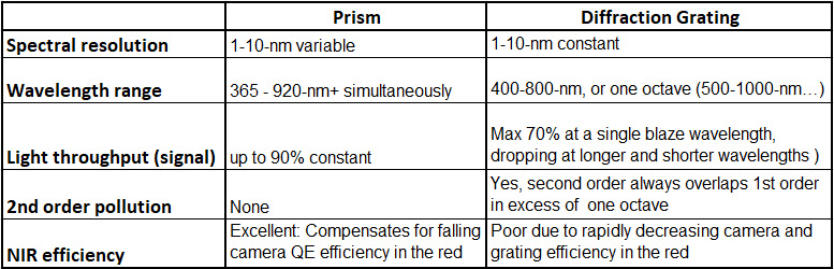
Q:When is a prism spectrometer preferable to diffraction grating spectrometer?” A: It is best to use a prism in low-light applications where high sensitivity and high signal-to-noise ratios are of maximum importance. High efficiency ensures the highest sensitivity. If we consider the PARISS prism, the light throughput efficiency between 365 to 1000-nm is up to 90%. A typical diffraction grating offers a peak efficiency at the blaze wavelength of around 60% with a drop-off on both the long and short wavelength sides. Q: When is a diffraction grating spectrometer preferable to a prism spectrometer? A: Best for use with diverse bright-light applications demanding different spectral ranges and spectral resolution. Interchangeable gratings are available with various groove densities and blaze wavelengths to meet spectral range and resolution requirements. (Spectral resolution varies linearly with groove density) Q: Do all diffraction gratings suffer from 2nd order overlap with 1st order.” A: All diffraction orders are an inherent form of spectral pollution that degrades diffraction grating performance. Reducing the wavelength range to just one octave (2x initial wavelength such as 400 to 800-nm), eliminates higher-order overlap. The inherent presence of higher orders significantly reduces diffraction grating efficiency, therefore reducing sensitivity. Q: Hpw does the wavelength dispersion of a prism compare to that of a diffraction grating? A: The wavelength dispersion of a prism is non-linear. Spectral resolution (bandpass) is highest in the UV and blue and decreases at longer wavelengths, which is actually an advantage! The increasing bandpass at longer wavelengths compensates for the falling quantum efficiency of a CCD or CMOS over the same wavelength range. The net result is a flatter efficiency profile and significantly higher signal-to-noise ratio over a wider wavelength range than is possible with a diffraction grating. The wavelength dispersion of a diffraction grating is close to linear, resulting in a gradual reduction in signal- to-noise ratio with increasing wavelength. (Actual bandpass varies as the cosine of the diffraction angle)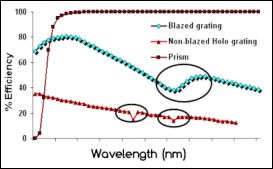
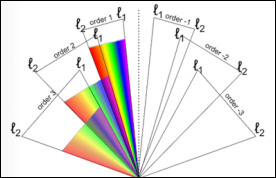
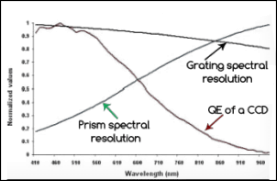
Figure 1: Prism vs diffraction grating
efficiency curves. Diffraction grating
efficiency profiles vary, but never equal
the efficiency of a prism.
Figure 2: With some exceptions most
diffraction gratings are used in first
order. However, gratings also diffracts
light into plus and minus orders that
overlap first order
Figure 3: All spectrometer components
can present wavelength efficiency
issues. Signal to noise ratio S/N is a
product of bandpass and efficiency. The
efficiency curve of most cameras falls
with increasing wavelength.
The spectral resolution of a prism goes a
long way to compensate and offer high
S/N at long wavelengths that are a
problem for diffraction gratings.


Either a prism or a diffraction grating is used
as the wavelength dispersive element in most
optical spectrometers.
This page contrasts and compare the
performance characteristics of each.
Prism Versus Diffraction Grating?
Prism Versus Diffraction Grating Performance
Detailed Diffraction Grating
Characteristics
Grating “Pros” • Off the shelf optional groove densities and wavelength dispersion options • Wide selection of blaze wavelengths Grating “Cons” • Produced either mechanically with burnished grooves (incorporates “ruling errors”) or holographically with limited groove density potential • All have a peak efficiency at just one wavelength (the “blaze” wavelength). Diffraction efficiency drops off rapidly to shorter and gradually to longer wavelengths. See Figure 1 • Grating efficiency curves present “anomalies” or discontinuities in the efficiency profile. • Classical “mechanically ruled” gratings are more efficient that those produced holographically • The efficiency curves of all diffraction gratings are affected by light diffraction into higher “orders” • Each order is one octave, for example, 400 to 800-nm. Second order will be 200 to 400-nm and overlay first order. See Figure 2 • To remove second order overlap order sorting filters are required • In actual practice peak efficiency of a diffraction grating is almost always less than 70% and can drop to near zero at the extremities of its spectral range • Wavelength dispersion (nm/mm) is non-linear varying as the diffraction angle and the distance to focus at each wavelength. In practice, wavelength dispersion is linear enough to present near constant resolution especially for low resolution instruments Bottom line: Ruled gratings are more efficient than many holographic gratings when considered over a wide wavelength range. Nevertheless diffraction gratings cannot be used over a wavelength range greater than an octave without order sorting filters.Detailed Prism Spectrometer
Characteristics Pros and Cons
The major attraction of a prism is the near <90% average transmission efficiency at all wavelengths above ~365-nm. The efficiency profile is flat with no drop-off after ~400-nm. In terms of efficiency a prism will outperform all diffraction gratings. Prism “Pros” Ironically non-linear wavelength dispersion! As the QE of a camera decrease at longer wavelengths bandpass falls to compensate. Consequently, a prism delivers significantly higher signal to noise ratio over an extended wavelength range than a diffraction grating. See Figure 3. Transmission efficiency is a flat > 90% over the bulk of a wavelength range above ~400- nm outperforming all diffraction gratings Refraction does not result in “overlapping orders,” consequently a prism operates over greater than one octave without requiring filtering. Prisms work from 365 to 920-nm or above. Figure 4. Diffraction gratings split up incoming light into diffraction orders reducing efficiency. To see the PARISS imaging prism spectrograph click here Prism “Cons” • Compared to gratings, prisms are very expensive. Only high end instruments addressing challenging applications use a prism. • Wavelength dispersion is non-linear, consequently bandpass and resolution change from high in the blue to lower in the red. Linearizing dispersion is trivial in the software, but does not compensate for impact of changing bandpass. • Prism spectrometers share non-linear dispersion with both AOTF and LCTF devices (Acousto optic tunable filters and Liquid Crystal Tunable filters)Best Uses For Prism and Diffraction
Grating Spectrometers FAQ
Q:When is a prism spectrometer preferable to diffraction grating spectrometer?” A: It is best to use a prism in low-light applications where high sensitivity and high signal-to-noise ratios are of maximum importance. High efficiency ensures the highest sensitivity. If we consider the PARISS prism, the light throughput efficiency between 365 to 1000-nm is up to 90%. A typical diffraction grating offers a peak efficiency at the blaze wavelength of around 60% with a drop-off on both the long and short wavelength sides. Q: When is a diffraction grating spectrometer preferable to a prism spectrometer? A: Best for use with diverse bright-light applications demanding different spectral ranges and spectral resolution. Interchangeable gratings are available with various groove densities and blaze wavelengths to meet spectral range and resolution requirements. (Spectral resolution varies linearly with groove density) Q: Do all diffraction gratings suffer from 2nd order overlap with 1st order.” A: All diffraction orders are an inherent form of spectral pollution that degrades diffraction grating performance. Reducing the wavelength range to just one octave (2x initial wavelength such as 400 to 800- nm), eliminates higher-order overlap. The inherent presence of higher orders significantly reduces diffraction grating efficiency, therefore reducing sensitivity. Q: Hpw does the wavelength dispersion of a prism compare to that of a diffraction grating? A: The wavelength dispersion of a prism is non- linear. Spectral resolution (bandpass) is highest in the UV and blue and decreases at longer wavelengths, which is actually an advantage! The increasing bandpass at longer wavelengths compensates for the falling quantum efficiency of a CCD or CMOS over the same wavelength range. The net result is a flatter efficiency profile and significantly higher signal-to-noise ratio over a wider wavelength range than is possible with a diffraction grating. The wavelength dispersion of a diffraction grating is close to linear, resulting in a gradual reduction in signal-to-noise ratio with increasing wavelength. (Actual bandpass varies as the cosine of the diffraction angle)
Figure 1: Prism vs diffraction grating
efficiency curves. Diffraction grating
efficiency profiles vary, but never equal the
efficiency of a prism.
Figure 2: With some exceptions most diffraction
gratings are used in first order. However, gratings
also diffracts light into plus and minus orders that
overlap first order
Figure 3: All spectrometer components can present
wavelength efficiency issues. Signal to noise ratio S/N is
a product of bandpass and efficiency. The efficiency curve
of most cameras falls with increasing wavelength.
The spectral resolution of a prism goes a long way to
compensate and offer high S/N at long wavelengths that
are a problem for diffraction gratings.