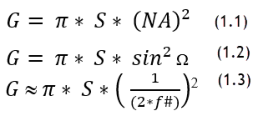
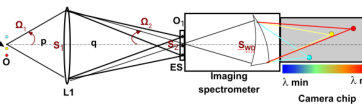
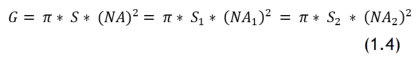
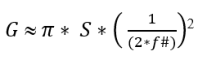
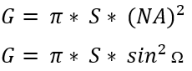
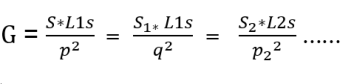
Geometric etendue (geometric extent), G, characterizes the ability of an optical system to accept light. It is a
function of the area, S, of the emitting source and the solid angle, Ω, into which it propagates. See figure 1,
then:
(1.1)
(1.2)
(1.3)
(1.4)
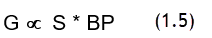
G in terms of bandpass:
(1.5)
2.
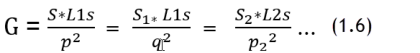
G can be simplified to:
(1.6)
and so on, for all optics in the train. All these parameters are either known or easily determined
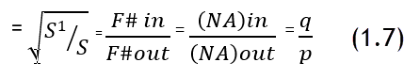
3.
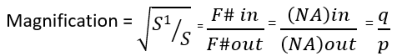
Magnification
(1.7)
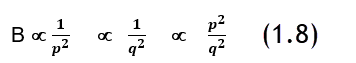
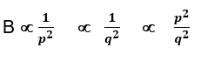
And brightness =
( 1.8)
G.
Summary takeaways
a.
Identify the elements in the optical train that limit etendue, and you identify the light throughput bottle-
neck.
b.
For narrow bandpass emissions, throughput varies linearly with the area of the entrance slit.
Therefore, given that spectral bandpass varies linearly with slit-width, go for the maximum slit-width
possible for a required bandpass
c.
For continuum spectra, throughput varies as the square of the slit width
d.
BP varies linearly with slit-width
e.
Throughput varies with the square of the ratio of f-number or numerical aperture (conditions familiar to
most, if not all, photographers.) (1.4)
f.
Brightness B varies with the square of the magnification (1.8)
g.
The slit-width should correspond to the size of the image of objects in the FOV.
h.
All cones of light described by NA or f-number must result in perfectly filled optics or apertures. (1.4)
i.
Objects in the distance require collection optics with a large collection area, such as a telescope.
j.
Near-field objects require high NA optics, such as a microscope objective
H.
Worked example optimizing f/2 collection to work with an f/5 spectrometer:
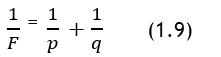
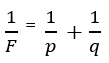
Simplistically, for a thin lens
(1.9)
Where
F = focal length (Focus of an object at infinity)
p = distance of lens to FOV (object distance)
q = distance of lens to spectrometer (Image distance)
D = diameter
Then selecting the nearest online catalog achromat (*Edmund Optics #32-319)
D = 25-mm
F = 35-mm
p = 49-mm
q = 125-mm
Od = Object diameter = up to 9-micron (e.g. biological cells)
Then:
1.
Spectrometer: f/5
2.
Entrance optic EO diameter D = 25-mm aperture masked to 24.5-mm
3.
Distance from EO to the FOV = q = 49
4.
Therefore, the entry f-number of the EO = p/d = 49/24.5 = 2
5.
Distance from EO to the entrance slit = p = 125
6.
The exit f-number = 125/24.5 = f/5.1 (Under-fills the spectrometer so all good!)
7.
Magnification = q/p = 125/49 = 2.6
8.
The image of the object = 9*2.6 = 23.4-micron and is contained within ES.
9.
Brightness will decrease by a factor of 0.15x
(1.8)
All photons in the original object are distributed over a greater area thereby reducing brightness by a factor of
0.15x. However, NO photons were lost .
I.
Optimizing a light light collection of distant objects to work with an f/5 spectrometer:
Selecting the nearest online catalog achromat (*Edmund Optics #32-327
)
D = 25-mm
F = 100-mm
q = 125-mm
(distance of L1 to the spectrometer)
p = 500-mm (distance of L1 to the FOV)
Od = Object diameter = up to 60-micron
Then:
1.
The effective exit f-number of the EO = q/d = 125/25 = 5 = the f-number of the spectrometer (as in the
previous example)
2.
De-magnification = 125/500 = 0.4x
3.
The image of a 60-micron objects is de-magnified by 4 resulting in 24-micron images. (60*0.4 = 24-
micron)
4.
For a 25-micron wide standard entrance slit-width = each 24-micron image of the object will be
captured by the entrance slit, without light loss.
5.
The brightness of the image will increase by a factor of 16x.
6.
The light collection of the system will be f/20
In each of the above examples, the entrance slit fully accommodates the projected image of the objects in the
FOV and the illuminating light cones of light match the spectrometer f-number.
J.
Summary, limitations, caveats and constraints
1.
Off-the-shelf parts entrance optics are unlikely to fulfill all the parameters required for optimum
system performance. The stock lenses shown in the examples are for illustration purposes only,
and are NOT recommended or endorsed.
2.
The area occupied by the wavelength range of the spectrometer is almost never negotiable. If
the minimum and maximum wavelengths in the range occupy a given distance, the camera chip must
be large enough to accommodate it.
3.
Imaging the entrance slit: All wavelength dispersive spectrometers image the entrance slit onto the
spectrum detector.
However, to meet the Rayleigh and Nyquist criteria for optimum resolution and light throughput, the
slit-width should be at least three pixels wide.
Choosing the optimum slit-width should be discussed with the spectrometer manufacturer.
4.
Camera pixel size: Two points of consideration
a.
small pixels limit well-depth and linear dynamic range
b.
Large pixels limit spectral bandpass due to the increased slit-width needed to accommodate three
pixels.
5.
Light collection entry optics: Working with commercial photographic camera lenses can be a
challenge when optimizing a spectrometer system. You will need to obtain data sheets that detail
chromatic aberration over your wavelength range, coatings that cut off at certain wavelengths, and
interfacing constraints.
Most spectrometers, including PARISS, use c-mount lenses; however, commercial photographic
camera lenses use a variety of interfaces, including bayonet fittings. Adapters are available to convert
to c-mount, but overall performance often degrades.
D. Know your spectrometer
A spectrometer system consists of three major sub-assemblies:
1.
A spectrometer: We will use the PARISS imaging spectrometer as an example.
2.
A spectrum detector: We will use a CCD or CMOS camera as the spectrum detector.
3.
Fore-optics: Elements that precede the spectrometer that collect light from the FOV and delivers
it to the spectrometer. Could be microscope objectives, telescopes, focusing mirrors, lenses.
E. Assembly details
1.
Imaging spectrograph: A spectrometer that delivers spatial resolution along the length of the
slit, perpendicular to the wavelength dispersion axis, and along the dispersion axis itself.
2.
A spectrograph becomes a spectrometer when equipped with a spectral output device such
as a camera.
3.
Wavelength dispersion (WD): measured in nm/mm.
WD is more or less constant with a diffraction grating, but varies non-linearly with a prism. Note
well: non-linear wavelength dispersion significantly extends the useful wavelength range of a
spectrometer compared to a diffraction grating. It is not a disadvantage. See here
4.
Entrance slit (ES): The ES is characterized by its slit-width (w) and slit height (h). The slit-width
controls the bandpass and resolution of the instrument. As such, it is one of the most critical
parameters of the instrument.
All spectrometers image the ES onto an exit plane (hence the origin of the term “line spectra” when
characterizing elemental ion-type emissions).
The width of an individual line feature is the projected width of ES, and determines the spectral bandpass
as a function of WD. The height of ES determines the spatial component.
5.
Bandpass (BP): BP = Slit-width x wavelength dispersion (BP= w x WD) or the width of camera
pixels, whichever is greater.
There can be a conflict between the need for a certain spectral resolution (bandpass) and the optimum
slit-width needed for maximum light throughput.
6.
Bandpass (FWHM): is the observed Full Width at Half Maximum (FWHM) of an “infinitely” narrow
line spectrum at the exit plane of the spectrometer.
(In practice, use a low-pressure Hg lamp, a MIDL lamp, or a single-mode laser to check the actual
bandpass.)
The FWHM should be three pixels wide for an optimized camera or as many pixels that correspond to the
width of the image of the entrance slit.
If the width of camera pixels is larger than the image of the entrance slit, then the camera pixels
determine spectral bandpass.
7.
Bandpass or resolution? Resolution is the bandpass (w x WD) when reducing w results in no
reduction in bandpass.
8.
“Resolution” is a function of residual aberrations and geometric optics (wavelength, Airy
disk…) in the optics.
The terms “Bandpass” and “spectral resolution” are only interchangeable when the entrance slit is at its
narrowest (also, light throughput will be at its lowest - see why later in this document)
9.
Spectral range on the camera chip: The wavelength dispersion determines the length of a
spectral range in mm. If the wavelength range is 365- 920-nm over 8-mm, then the chip must be at
least 8-mm in width. The height of the chip must exceed the height of the entrance slit.
10.
Spectral distribution on the camera chip: The spectrum detector will be a CMOS or CCD camera.
Spectral distribution is along pixel rows (in “x”). Spatial resolution of objects imaged on the entrance
slit along columns (in “y”).
11.
Characteristics of wavelength dispersive element
a.
Diffraction grating efficiency peaks at a single wavelength (the blaze wavelength) and tapers
off rapidly at wavelengths shorter and more gradually to wavelengths longer than blaze. At best,
peak efficiency will be around <60-70% at blaze. Most light losses are due to light diffracted into
higher orders. There can also be a polarization component that contributes to lower efficiency.
b.
A prism refracts light: Therefore higher-order problems do not exist. A prism offers inherent
light transmission in above 90% from 400-1000-nm and greater than <80% at 365-nm. There is
no intrinsic polarization factor.
A prism is ideal when a light source presents weak spectra.
12.
Impact of entrance slit-width: The width of the entrance slit should be at least three pixels wide.
In practice, the PARISS spectrograph is supplied with a fixed entrance slit-width, either 25, 50 or
100-micron.
13.
Impact of spectrometer focal length: Wavelength dispersion varies linearly with focal length.
Long focal length instruments deliver higher resolution than short focal length instruments and can
accommodate wider entrance slit widths.
14.
Pixel-size considerations: Many spectroscopic applications present objects in the FOV that vary
considerably in brightness.
a.
Small pixel camera chip (<5-micron): Small pixels lack the electron well-depth required to
handle the linear dynamic range of weak and strong signals from the FOV.
A good partial solution, in this case, is to bin pixels, thereby creating a “larger” pixel with an increase in
well-depth. The increase will not be linear, but is still an improvement over small, non-binned pixels.
b.
Large pixel, greater than 15-micron camera chip: The image of a 25-micron entrance slit will
under-fill three pixels resulting in a loss of bandpass and efficiency. In this case, it is best to
increase the slit-width to 50-micron.

F.
Light throughput is all about etendue (also called “geometric extent.”)
How To Optimize Spectrometer Light Throughput
for Maximum Sensitivity
1.
Definitions
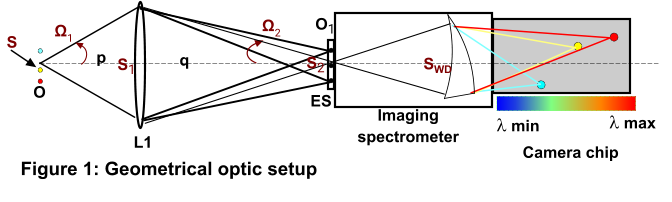
O:
Objects in the field-of-view (FOV) with area S
S:
Area of objects in the FOV
L1:
Light collection fore-optics can be a lens or front-surface mirror.
L1 is responsible for bringing light from the FOV to the spectrometer.
Ω
1
:
Entrance half-angle subtended by light collection optic L
1
p:
Entrance path distance from FOV to L
1
q:
Exit path distance from L1 to the entrance slit
Ω
2
:
Exit half-angle subtended by L
1
to image plane at the entrance slit
L1
S
:
Illuminated area of L1
ES:
Entrance slit of the spectrometer
S
2
:
Area of the entrance slit. Should accommodate the image of objects in the FOV.
w:
Entrance slit-width (3 or more camera pixels wide)
h:
Entrance slit-height
O
1
:
Magnified image of objects (q/p) in the FOV with area S
2
S
WD
:
Area of the prism or grating wavelength dispersive element: (PARISS prism shown)
B:
Radiance (Luminance) The intensity when spread over a given surface.
Intensity/Surface area of the source in watts/steradian/cm2.
B varies inversely with the square of either p or q
A.
Introduction
Simply put, we have a sample area that reflects transmits or emits light that must be projected through the
entrance slit of the spectrometer with minimal losses.
We use Geometric etendue (geometric extent), G, to characterize the ability of an optical system to accept
light. It is a function of the area, S, of the emitting, reflecting or transmitting source and the solid angle, (Ω),
into which it propagates. Etendue therefore, is a limiting function of system throughput. The optic with the
lowest G value creates the light-throughput bottle-neck.
While not a geometric factor, light throughput also depends on the characteristics of the sample spectra,
and is not included in etendue calculations. Light throughput is affected by whether light is narrow versus
band radiation.
B.
Know the spectral characteristics of your light source spectra
1.
Line spectra such as atomic emission: For example, elemental excitation, astronomy, ion-
discharge lamps …
2.
Continuum spectra typical in hyperspectral imaging: The light source emits a continuous spectrum
without a break, such as a halogen lamp. Applications include remote Earth sensing used by the
USGS, USEPA, USDA, color measurement, analytical laboratories, forensics…
3.
Hybrid such as fluorescence, LED, OLED, where a bandpass can be considered a continuum over
a short wavelength range.
C. Know the nature of the spectra you work with: line, continuum, or hybrid
1.
For a continuum light source: Light throughput increases with the square of the slit width.
(There are available photons with increasing bandpass).
2.
For line emission spectra: Light throughput increases linearly with slit width. (There are a
fixed number of photons in a particular emission line. There are no additional photons in the
source to add with increasing slit width.)
3.
Hybrid emission: Light throughput increases with the square of slit-width over a limited
wavelength range, then plateaus.

*The catalog lenses are for illustration only.


*The catalog lenses are for illustration only.
How To Optimize Spectrometer Light
Throughput for Maximum Sensitivity
A.Introduction Simply put, we have a sample area that reflects transmits or emits light that must be projected through the entrance slit of the spectrometer with minimal losses. We use Geometric etendue (geometric extent), G, to characterize the ability of an optical system to accept light. It is a function of the area, S, of the emitting, reflecting or transmitting source and the solid angle, (Ω), into which it propagates. Etendue therefore, is a limiting function of system throughput. The optic with the lowest G value creates the light-throughput bottle-neck. While not a geometric factor, light throughput also depends on the characteristics of the sample spectra, and is not included in etendue calculations. Light throughput is affected by whether light is narrow versus band radiation. B.Know the spectral characteristics of your light source spectra 1. Line spectra such as atomic emission: For example, elemental excitation, astronomy, ion- discharge lamps … 2. Continuum spectra typical in hyperspectral imaging: The light source emits a continuous spectrum without a break, such as a halogen lamp. Applications include remote Earth sensing used by the USGS, USEPA, USDA, color measurement, analytical laboratories, forensics… 3. Hybrid such as fluorescence, LED, OLED, where a bandpass can be considered a continuum over a short wavelength range. C.The impact on light throughput as a function of spectral “type” 1. For a continuum light source: Light throughput increases with the square of the slit width. (There are available photons with increasing bandpass). 2. For line emission spectra: Light throughput increases linearly with slit width. (There are a fixed number of photons in a particular emission line. There are no additional photons in the source to add with increasing slit width.) 3. Hybrid emission: Light throughput increases with the square of slit-width over a limited wavelength range, then plateaus. D.Know your spectrometer A spectrometer system consists of three major sub- assemblies: 1. A spectrometer: We will use the PARISS imaging spectrometer as an example. 2. A spectrum detector: We will use a CCD or CMOS camera as the spectrum detector. 3. Fore-optics: Elements that precede the spectrometer that collect light from the FOV and delivers it to the spectrometer. Could be microscope objectives, telescopes, focusing mirrors, lenses. E. Assembly details 1. Imaging spectrograph: A spectrometer that delivers spatial resolution along the length of the slit, perpendicular to the wavelength dispersion axis, and along the dispersion axis itself. 2. A spectrograph becomes a spectrometer when equipped with a spectral output device such as a camera. 3. Wavelength dispersion (WD): measured in nm/mm. WD is more or less constant with a diffraction grating, but varies non-linearly with a prism. Note well: non-linear wavelength dispersion significantly extends the useful wavelength range of a spectrometer compared to a diffraction grating. It is not a disadvantage. See here 4. Entrance slit (ES): The ES is characterized by its slit-width (w) and slit height (h). The slit-width controls the bandpass and resolution of the instrument. As such, it is one of the most critical parameters of the instrument. All spectrometers image the ES onto an exit plane (hence the origin of the term “line spectra” when characterizing elemental ion-type emissions). The width of an individual line feature is the projected width of ES, and determines the spectral bandpass as a function of WD. The height of ES determines the spatial component. 5. Bandpass (BP): BP = Slit-width x wavelength dispersion (BP= w x WD) or the width of camera pixels, whichever is greater. There can be a conflict between the need for a certain spectral resolution (bandpass) and the optimum slit-width needed for maximum light throughput. 6. Bandpass (FWHM): is the observed Full Width at Half Maximum (FWHM) of an “infinitely” narrow line spectrum at the exit plane of the spectrometer. (In practice, use a low-pressure Hg lamp, a MIDL lamp, or a single-mode laser to check the actual bandpass.) The FWHM should be three pixels wide for an optimized camera or as many pixels that correspond to the width of the image of the entrance slit. If the width of camera pixels is larger than the image of the entrance slit, then the camera pixels determine spectral bandpass. 7. Bandpass or resolution? Resolution is the bandpass (w x WD) when reducing w results in no reduction in bandpass. “Resolution” is a function of residual aberrations and geometric optics (wavelength, Airy disk…) in the optics. The terms “Bandpass” and “spectral resolution” are only interchangeable when the entrance slit is at its narrowest (also, light throughput will be at its lowest - see why later in this document) 8. Spectral range on the camera chip: The wavelength dispersion determines the length of a spectral range in mm. If the wavelength range is 365- 920-nm over 8-mm, then the chip must be at least 8-mm in width. The height of the chip must exceed the height of the entrance slit. 9. Spectral distribution on the camera chip: The spectrum detector will be a CMOS or CCD camera. Spectral distribution is along pixel rows (in “x”). Spatial resolution of objects imaged on the entrance slit along columns (in “y”). 10. Characteristics of wavelength dispersive element a. Diffraction grating efficiency peaks at a single wavelength (the blaze wavelength) and tapers off rapidly at wavelengths shorter and more gradually to wavelengths longer than blaze. At best, peak efficiency will be around <60-70% at blaze. Most light losses are due to light diffracted into higher orders. There can also be a polarization component that contributes to lower efficiency. b. A prism refracts light: Therefore higher-order problems do not exist. A prism offers inherent light transmission in above 90% from 400-1000-nm and greater than <80% at 365-nm. There is no intrinsic polarization factor. A prism is ideal when a light source presents weak spectra. 11. Impact of entrance slit-width: The width of the entrance slit should be at least three pixels wide. In practice, the PARISS spectrograph is supplied with a fixed entrance slit-width, either 25, 50 or 100-micron. 12. Impact of spectrometer focal length: Wavelength dispersion varies linearly with focal length. Long focal length instruments deliver higher resolution than short focal length instruments and can accommodate wider entrance slit widths. 13. Pixel-size considerations: Many spectroscopic applications present objects in the FOV that vary considerably in brightness. a. Small pixel camera chip (<5-micron): Small pixels lack the electron well-depth required to handle the linear dynamic range of weak and strong signals from the FOV. A good partial solution, in this case, is to bin pixels, thereby creating a “larger” pixel with an increase in well-depth. The increase will not be linear, but is still an improvement over small, non-binned pixels. b. Large pixel, greater than 15-micron camera chip: The image of a 25-micron entrance slit will under-fill three pixels resulting in a loss of bandpass and efficiency. In this case, it is best to increase the slit-width to 50-micron. F.Light throughput is all about etendue (also called “geometric extent.”) Figure 1: Geometrical optic setup Definitions O: Objects in the field-of-view (FOV) with area S S:Area of objects in the FOV L1: Light collection fore-optics can be a lens or front-surface mirror. L1 is responsible for bringing light from the FOV to the spectrometer. Ω1:Entrance half-angle subtended by light collection optic L1 p: Entrance path distance from FOV to L1 q: Exit path distance from L1 to the entrance slit Ω2: Exit half-angle subtended by L1 to image plane at the entrance slit L1S: Illuminated area of L1 ES:Entrance slit of the spectrometer S2: Area of the entrance slit. Should accommodate the image of objects in the FOV. w: Entrance slit-width (3 or more camera pixels wide) h:Entrance slit-height O1: Magnified image of objects (q/p) in the FOV with area S2 SWD: Area of the prism or grating wavelength dispersive element: (PARISS prism shown) B: Radiance (Luminance) The intensity when spread over a given surface. Intensity/Surface area of the source in watts/steradian/cm2. B varies inversely with the square of either p or q Geometric etendue (geometric extent), G, characterizes the ability of an optical system to accept light. It is a function of the area, S, of the emitting source and the solid angle, Ω, into which it propagates. See figure 1, then: G in terms of bandpass: G can be simplified to: and so on, for all optics in the train. All these parameters are either known or easily determined Magnification = And brightness = B G. Summary takeaways 1. Identify the elements in the optical train that limit etendue, and you identify the light throughput bottle-neck. 2. For narrow bandpass emissions, throughput varies linearly with the area of the entrance slit. Therefore, given that spectral bandpass varies linearly with slit-width, go for the maximum slit- width possible for a required bandpass 3. For continuum spectra, throughput varies as the square of the slit width 4. BP varies linearly with slit-width 5. Throughput varies with the square of the ratio of f-number or numerical aperture (conditions familiar to most, if not all, photographers.) (1.4) 6. Brightness B varies with the square of the magnification (1.8) 7. The slit-width should correspond to the size of the image of objects in the FOV. 8. All cones of light described by NA or f-number must result in perfectly filled optics or apertures. (1.4) 9. Objects in the distance require collection optics with a large collection area, such as a telescope. 10. Near-field objects require high NA optics, such as a microscope objective H. Worked example optimizing f/2 collection to work with an f/5 spectrometer: Simplistically, for a thin lens Where F = focal length (Focus of an object at infinity) p = distance of lens to FOV (object distance) q = distance of lens to spectrometer (Image distance) D = diameter Then selecting the nearest online catalog achromat (*Edmund Optics #32-319) D = 25-mm F = 35-mm p = 49-mm q = 125-mm Od = Object diameter = up to 9-micron (e.g. biological cells) Then: 1. Spectrometer: f/5 2. Entrance optic EO diameter D = 25-mm aperture masked to 24.5-mm 3. Distance from EO to the FOV = q = 49 4. Therefore, the entry f-number of the EO = p/d = 49/24.5 = 2 5. Distance from EO to the entrance slit = p = 125 6. The exit f-number = 125/24.5 = f/5.1 (Under- fills the spectrometer so all good!) 7. Magnification = q/p = 125/49 = 2.6 8. The image of the object = 9*2.6 = 23.4-micron and is contained within ES. 9. Brightness will decrease by a factor of 0.15x (1.8) All photons in the original object are distributed over a greater area thereby reducing brightness by a factor of 0.15x. However, NO photons were lost . I. Optimizing a light light collection of distant objects to work with an f/5 spectrometer: Selecting the nearest online catalog achromat (*Edmund Optics #32-327) D = 25-mm F = 100-mm q = 125-mm(distance of L1 to the spectrometer) p = 500-mm (distance of L1 to the FOV) Od = Object diameter = up to 60-micron Then: 1. The effective exit f-number of the EO = q/d = 125/25 = 5 = the f-number of the spectrometer (as in the previous example) 2. De-magnification = 125/500 = 0.4x 3. The image of a 60-micron objects is de- magnified by 4 resulting in 24-micron images. (60*0.4 = 24-micron) 4. For a 25-micron wide standard entrance slit- width = each 24-micron image of the object will be captured by the entrance slit, without light loss. 5. The brightness of the image will increase by a factor of 16x. 6. The light collection of the system will be f/20 In each of the above examples, the entrance slit fully accommodates the projected image of the objects in the FOV and the illuminating light cones of light match the spectrometer f-number. J.Summary, limitations, caveats and constraints 1. Off-the-shelf parts entrance optics are unlikely to fulfill all the parameters required for optimum system performance. The stock lenses shown in the examples are for illustration purposes only, and are NOT recommended or endorsed. 2. The area occupied by the wavelength range of the spectrometer is almost never negotiable. If the minimum and maximum wavelengths in the range occupy a given distance, the camera chip must be large enough to accommodate it. 3. Imaging the entrance slit: All wavelength dispersive spectrometers image the entrance slit onto the spectrum detector. However, to meet the Rayleigh and Nyquist criteria for optimum resolution and light throughput, the slit-width should be at least three pixels wide. Choosing the optimum slit-width should be discussed with the spectrometer manufacturer. 4. Camera pixel size: Two points of consideration a. small pixels limit well-depth and linear dynamic range b. Large pixels limit spectral bandpass due to the increased slit-width needed to accommodate three pixels. 5. Light collection entry optics: Working with commercial photographic camera lenses can be a challenge when optimizing a spectrometer system. You will need to obtain data sheets that detail chromatic aberration over your wavelength range, coatings that cut off at certain wavelengths, and interfacing constraints. Most spectrometers, including PARISS, use c- mount lenses; however, commercial photographic camera lenses use a variety of interfaces, including bayonet fittings. Adapters are available to convert to c-mount, but overall performance often degrades.